 info@stockbinge.com.au
 03 8609 4895

Blog Details
- Home
- Blog Details
Northern Star vs Evolution Mining vs Newmont: ASX Gold Major Comparison 2026
Northern Star Resources, Evolution Mining and Newmont are major ASX gold stocks available to Australian-market investors, but they offer different types of exposure. Northern Star Resources (ASX: NST) is an Australia-focused gold producer with an Alaskan operation. Evolution Mining (ASX: EVN) combines gold with copper across Australia and Canada. Newmont (ASX: NEM; NYSE: NEM) is a global, multi-metal producer.
This Northern Star vs Evolution Mining vs Newmont comparison looks beyond headline production figures. It examines gold production, all-in sustaining costs (AISC), mine geography, growth projects, balance-sheet position, commodity exposure and key mining risks.
Northern Star and Evolution report FY26 results for the year ended 30 June 2026, while Newmont reports FY2025 results for the year ended 31 December 2025. These different reporting periods and accounting conventions should be considered when comparing the three companies.
Quick Comparison: Northern Star vs Evolution Mining vs Newmont
| Company | Listing & Fiscal Year | Latest Gold Measure | Reported AISC | Main Exposure | Balance-Sheet Signal |
|---|---|---|---|---|---|
| Northern Star Resources | ASX: NST; year ended 30 June 2026 | 1.543Moz gold sold | A$2,698/oz | Gold; Australia and Alaska | Approximately 10% gearing and 0.1x leverage at FY26 year-end |
| Evolution Mining | ASX: EVN; year ended 30 June 2026 | 714,728oz gold produced | A$1,717/oz | Gold plus copper; Australia and Canada | Approximately A$19m net cash at FY26 year-end |
| Newmont | NYSE: NEM and ASX: NEM; year ended 31 December 2025 | 5.9Moz attributable gold | US$1,358/oz by-product AISC | Gold, copper, silver and other metals; global | US$2.1bn net cash at FY2025 year-end |
Important: This table is directional rather than a strict ranking. Northern Star reports gold sold, Evolution reports gold produced, and Newmont's figure includes attributable joint-venture and equity-method interests. AISC definitions and reporting conventions also differ between companies.
Northern Star Resources: An Australian Gold Specialist With KCGM Scale
Northern Star Resources operates Kalgoorlie and Yandal in Western Australia and Pogo in Alaska.
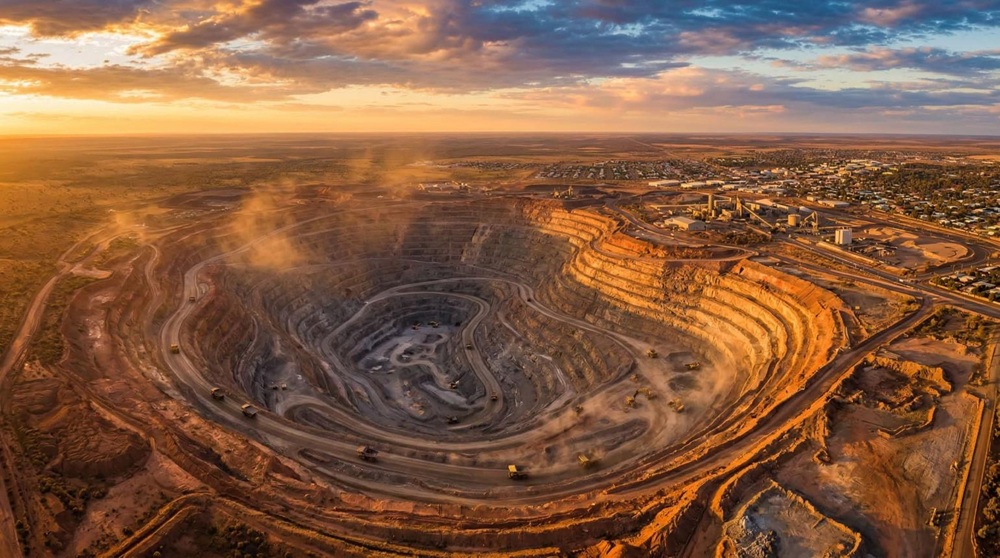
In FY26, Northern Star reported:
- 1.543 million ounces of gold sold
- A$2,698/oz group AISC
- A$7.623 billion revenue
- A$3.183 billion operating cash flow
- A$1.664 billion reported NPAT
KCGM Expansion
KCGM is Northern Star's key strategic asset. Its mill expansion is designed to increase processing capacity to 27 million tonnes per year.
Stage 1 entered commissioning at the end of FY26, with the ramp toward steady-state operations expected in FY29.
Hemi Development Project
Northern Star is also developing Hemi in Western Australia's Pilbara region.
At 31 March 2026, Northern Star reported:
- 13.198 million ounces of Hemi resources
- 5.508 million ounces of ore reserves
Hemi was not producing in FY26 and remains subject to approvals and a final investment decision.
Northern Star Growth and Execution Risks
Northern Star's growth profile comes with execution considerations. KCGM's expansion could increase throughput and recovery, but commissioning and cost inflation can affect results.
Hemi adds permitting, construction and development risks.
Underlying free cash flow was A$190.4 million after specified FY26 adjustments, compared with A$627.7 million statutory free cash flow.
Evolution Mining: Gold With Copper Diversification
Evolution Mining operates six mines across Australia and Canada. Five are wholly owned, while Evolution owns 80% of Northparkes.
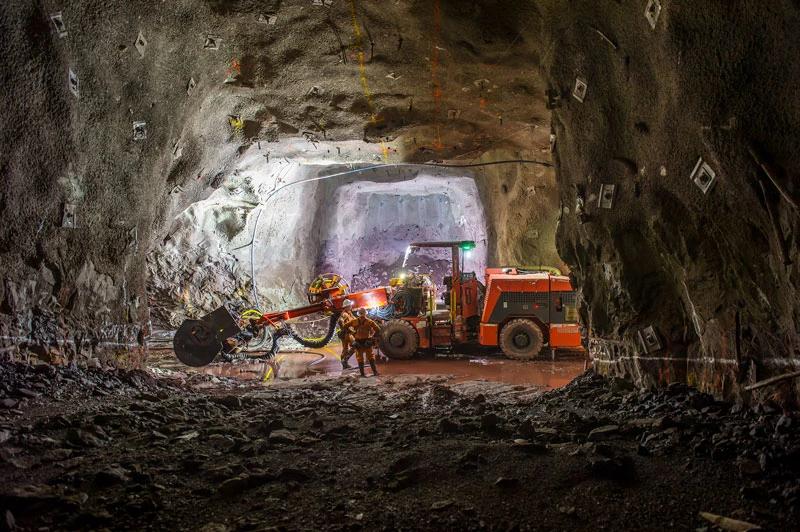
In FY26, Evolution reported:
- 714,728 ounces of gold produced
- 65,636 tonnes of copper produced
- A$1,717/oz group AISC
- A$5.559 billion revenue
- A$1.475 billion attributable statutory NPAT
- A$1.389 billion group cash flow
- Approximately A$19 million net cash at 30 June 2026
Why Evolution's AISC Needs Context
Evolution's reported AISC should not be treated as a simple cost comparison with Northern Star.
The company has meaningful copper production, which creates by-product credits against gold production costs. Ernest Henry and Northparkes reported negative gold AISC under Evolution's presentation because copper revenue exceeded the gold-attributed cost measure.
This can be economically meaningful, but it also means that cross-company AISC comparisons require caution.
Evolution Mining Growth Projects
Several projects provide additional growth options, including:
- Mungari's expanded 4.2Mtpa mill
- Cowal's open-pit continuation
- Northparkes E22
- Coarse-particle flotation
- Ernest Henry's Bert project
Evolution also announced a proposed A$213 million Carnaby Resources acquisition in July 2026. The transaction remained conditional at the research date.
Evolution Mining Risks
Evolution provides a mid-sized Australia–Canada portfolio with copper exposure and reported net cash.
Key risks include:
- Production volatility
- Project execution
- Weather
- Streaming arrangements
- Gold-price exposure
- Copper-price exposure
Newmont: The Global-Scale Gold Major
Newmont is substantially larger than either Australian peer.
For FY2025, Newmont reported:
- 5.7 million core attributable gold ounces
- 5.9 million total attributable gold ounces
- 28 million ounces of silver
- 135,000 tonnes of copper
- US$1,358/oz gold by-product AISC
Newmont Cash Flow and Balance Sheet
Newmont generated:
- US$10.3 billion operating cash flow
- US$7.3 billion free cash flow
during 2025.
The company also reduced debt by US$3.4 billion and ended the year with:
- US$2.1 billion net cash
- US$11.6 billion liquidity
Newmont's Global Mining Portfolio
Newmont's portfolio includes:
- Lihir
- Cadia
- Tanami
- Boddington
- Ahafo
- Merian
- Cerro Negro
- Yanacocha
- Peñasquito
The company also holds interests in Nevada Gold Mines, Pueblo Viejo and Fruta del Norte.
Newmont says its portfolio is expected to support approximately six million gold ounces per year for at least the next decade.
Newmont Growth Projects
Newmont's growth profile includes Ahafo North, which reached commercial production in October 2025.
The company is also developing the Lihir Nearshore Barrier extension, which is intended to extend mine life beyond 2040.
Newmont's global scale can support capital returns, but its geographic footprint also creates exposure to:
- Jurisdictional risk
- Permitting requirements
- Labour issues
- Foreign-exchange movements
- Geopolitical conditions
- Joint-venture and operational complexity
Northern Star vs Evolution Mining vs Newmont: What Type of Exposure Does Each Offer?
The three companies have different operating profiles, making it useful to consider what each company represents rather than relying on a single headline metric.
Northern Star: Australian Gold Growth Exposure
Northern Star provides direct exposure to gold production, with major Australian assets and an Alaskan operation.
KCGM and Hemi provide a visible growth pipeline, although the near-term outlook depends on commissioning, development spending and execution.
Evolution Mining: Gold and Copper Exposure
Evolution combines gold production with copper by-products and an Australia–Canada portfolio.
Its copper exposure can influence reported AISC and financial results, while its smaller scale can create greater sensitivity to individual mine performance, project timing and operational disruption.
Newmont: Global Scale and Diversification
Newmont provides the broadest portfolio and largest production scale of the three companies.
Its global footprint and multi-metal exposure provide diversification across assets and commodities, while also introducing additional jurisdictional, joint-venture and operational variables.
Key Risks to Compare Across the Three Gold Stocks
All three companies remain exposed to common mining-sector risks.
Commodity cycles can also affect other Australian resource stocks, making diversification across different commodities an important consideration when researching the broader resources sector.
Gold Price Risk
Changes in the gold price can affect revenue, margins and cash flow across gold-producing companies.
Operating Cost Risk
AISC can increase when labour, energy, maintenance, royalties or sustaining capital costs rise.
Production Risk
Production can be affected by:
- Weather
- Geotechnical conditions
- Plant reliability
- Mine sequencing
- Operational disruptions
Development and Project Risk
Growth projects can require significant capital and may experience delays, cost increases or changes to development assumptions.
Permitting and Regulatory Risk
Mining projects can be affected by approvals, environmental obligations, permitting requirements and changes in regulation.
Commodity-Mix Risk
Evolution and Newmont have meaningful exposure to commodities beyond gold. This means copper, silver and other metal prices can influence their financial results.
Northern Star vs Evolution Mining vs Newmont: What Investors Should Compare
A meaningful ASX gold stocks comparison should look beyond production and AISC.
Consider these factors together:
- Gold production and production growth
- AISC and how it is calculated
- Gold price exposure
- Copper and other by-product exposure
- Mine locations and jurisdictional risk
- Reserve and resource life
- Development projects
- Capital expenditure requirements
- Free cash flow generation
- Balance-sheet strength
- Ownership interests and joint ventures
- Operational and execution risks
The comparison is particularly important because the three companies report different fiscal periods, production measures, currencies and ownership structures.
Northern Star vs Evolution Mining vs Newmont FAQ
Is Northern Star bigger than Evolution Mining?
By FY26 gold scale, Northern Star reported 1.543 million ounces of gold sold, while Evolution reported 714,728 ounces of gold produced.
The measures are not identical, but Northern Star was the larger gold producer on the disclosed figures.
Which Company Has the Lowest AISC?
Evolution reported A$1,717/oz, Northern Star reported A$2,698/oz, and Newmont reported US$1,358/oz of by-product AISC.
These figures use different currencies and accounting conventions, so they should not be treated as a definitive cost ranking.
Is Newmont Listed on the ASX?
Yes. Newmont trades on the New York Stock Exchange as NEM and is also listed on the Australian Securities Exchange as NEM.
Which Company Has the Most Copper Exposure?
Evolution has meaningful copper exposure through Ernest Henry and Northparkes.
Newmont also produces copper alongside gold, silver, lead and zinc, while Northern Star is more directly focused on gold.
Is This Article a Buy or Sell Recommendation?
No. This article is an educational comparison of public disclosures.
A complete investment decision would also require consideration of current valuation, share-price data, portfolio objectives, tax considerations, risk tolerance and independent financial advice.
These company-level comparisons can also be considered alongside broader approaches to building an ASX 200-focused portfolio.
Final Takeaway
Northern Star Resources, Evolution Mining and Newmont represent three distinct gold-major profiles.
Northern Star combines Australian scale, an Alaskan operation and the KCGM–Hemi growth pipeline.
Evolution Mining provides a smaller Australia–Canada portfolio with copper by-products and a reported move into net cash.
Newmont offers global production scale, broad commodity exposure and substantial capital-generation capacity.
The most important analytical discipline is not to compare the companies using one headline AISC figure alone. Investors should first align the fiscal years, currency, ownership basis, production definition and by-product treatment.
The next step is to examine how each company converts gold prices into sustainable free cash flow while funding mine development and managing operational risk.
References
[1] Northern Star Resources Financial Results Year Ended 30 June 2026
[2] Northern Star Resources June 2026 Quarterly Activities Report
[3] Newmont Reports Fourth Quarter and Full Year 2025 Results
[4] Northern Star Resources Hemi Development Project
[5] Evolution Mining Operations
[6] Evolution Mining FY26 Full Year Financial Results and Final Dividend
[7] Evolution Mining Annual Financial Report 2026
[8] Evolution Mining Expands Copper Growth Opportunities at Ernest Henry
[9] Newmont Operations and Projects
Investment disclaimer: This article is for general educational and informational purposes only. It is not financial advice, investment research tailored to an individual, or a recommendation to buy, hold or sell any security. Mining investments can lose value, and past performance does not guarantee future results.
Talk to Our Experts
ABN 54 672 177 347 | ACN 672 177 347
Copyright © 2026 StockBinge. All Right Reserved. Design by StockBinge.